
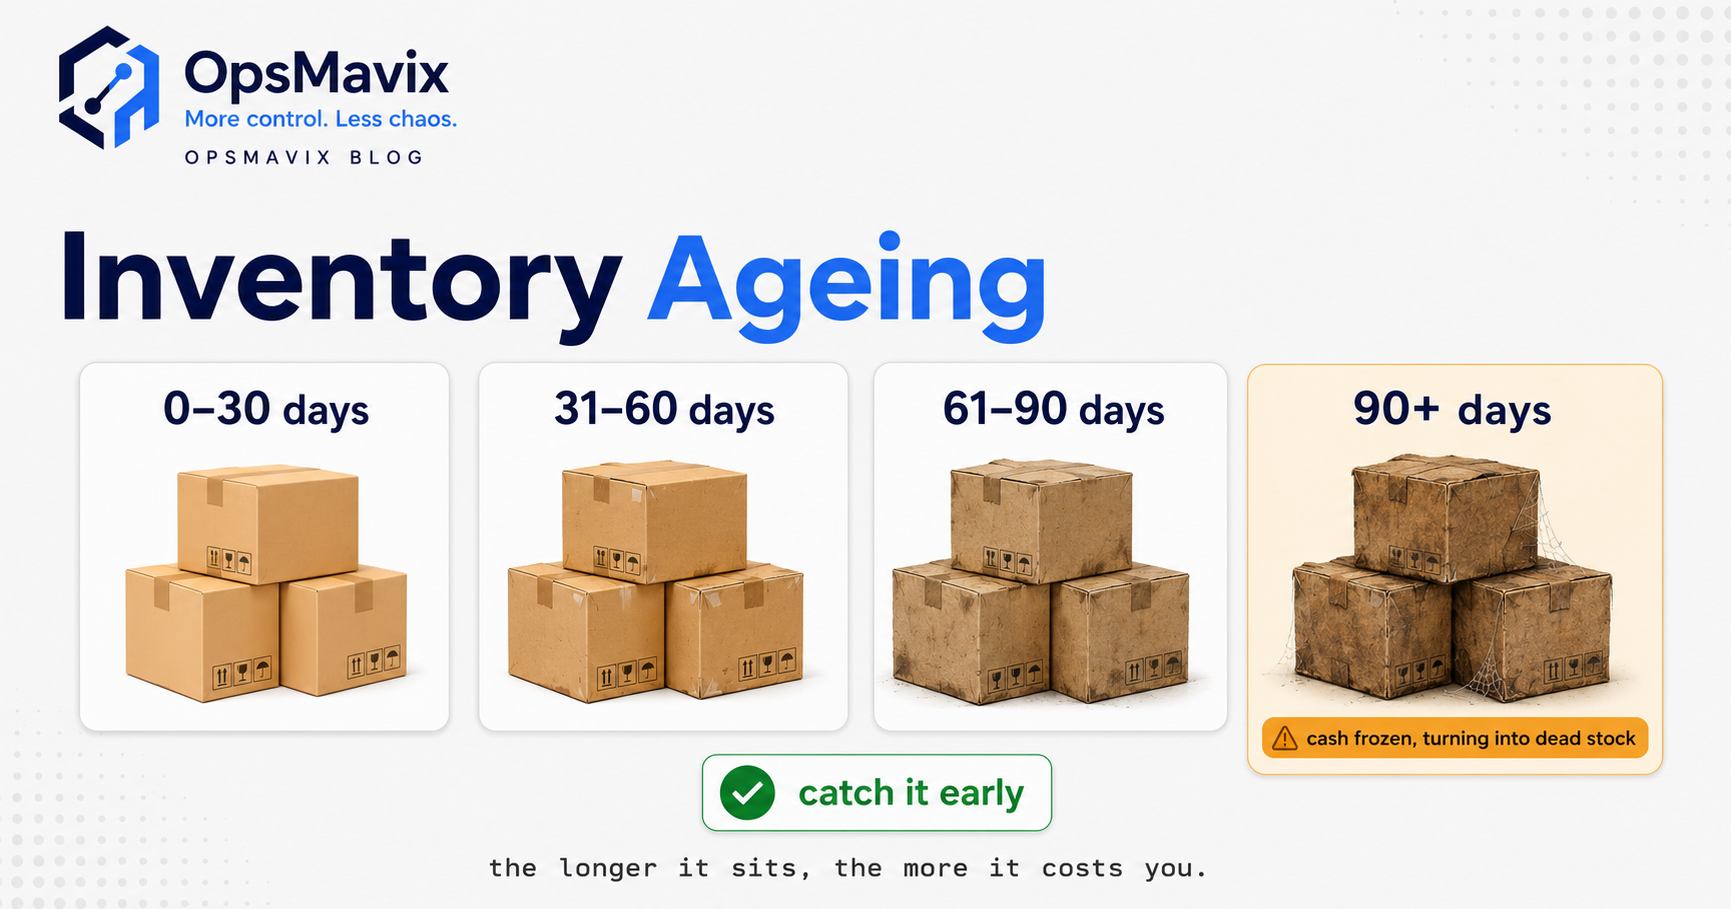
Inventory Ageing Analysis: Find the Stock That's Quietly Costing You
An inventory ageing analysis groups every SKU by how long it has sat unsold, so you catch slow movers while there is still time to act instead of finding out at stocktake. This walks through building the report from your own data, reading each ageing bucket, deciding what to do with each one — mark down, bundle, stop reordering, return to supplier — and keeping a live system flagging ageing stock automatically.
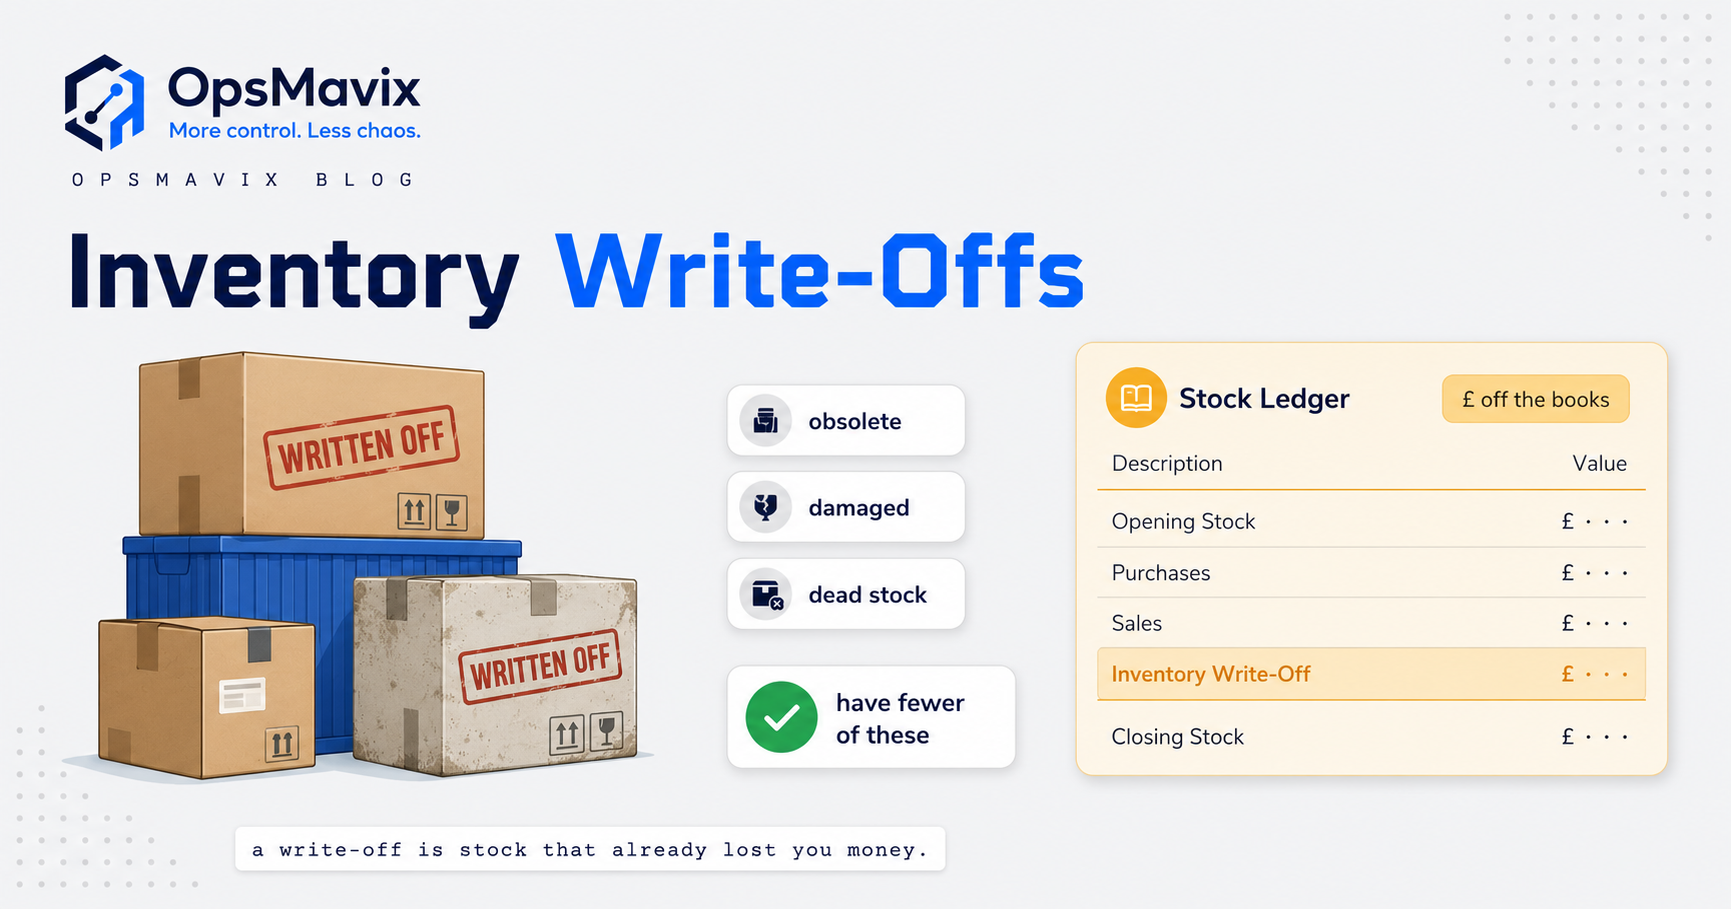
Inventory Write-Offs: When, How, and How to Have Fewer
An inventory write-off removes stock from your books once it can no longer be sold — lost, damaged, obsolete or stolen. Most guides stop at the accounting entry. This one joins the entry to the operational causes and, more usefully, to how you have fewer write-offs next year.
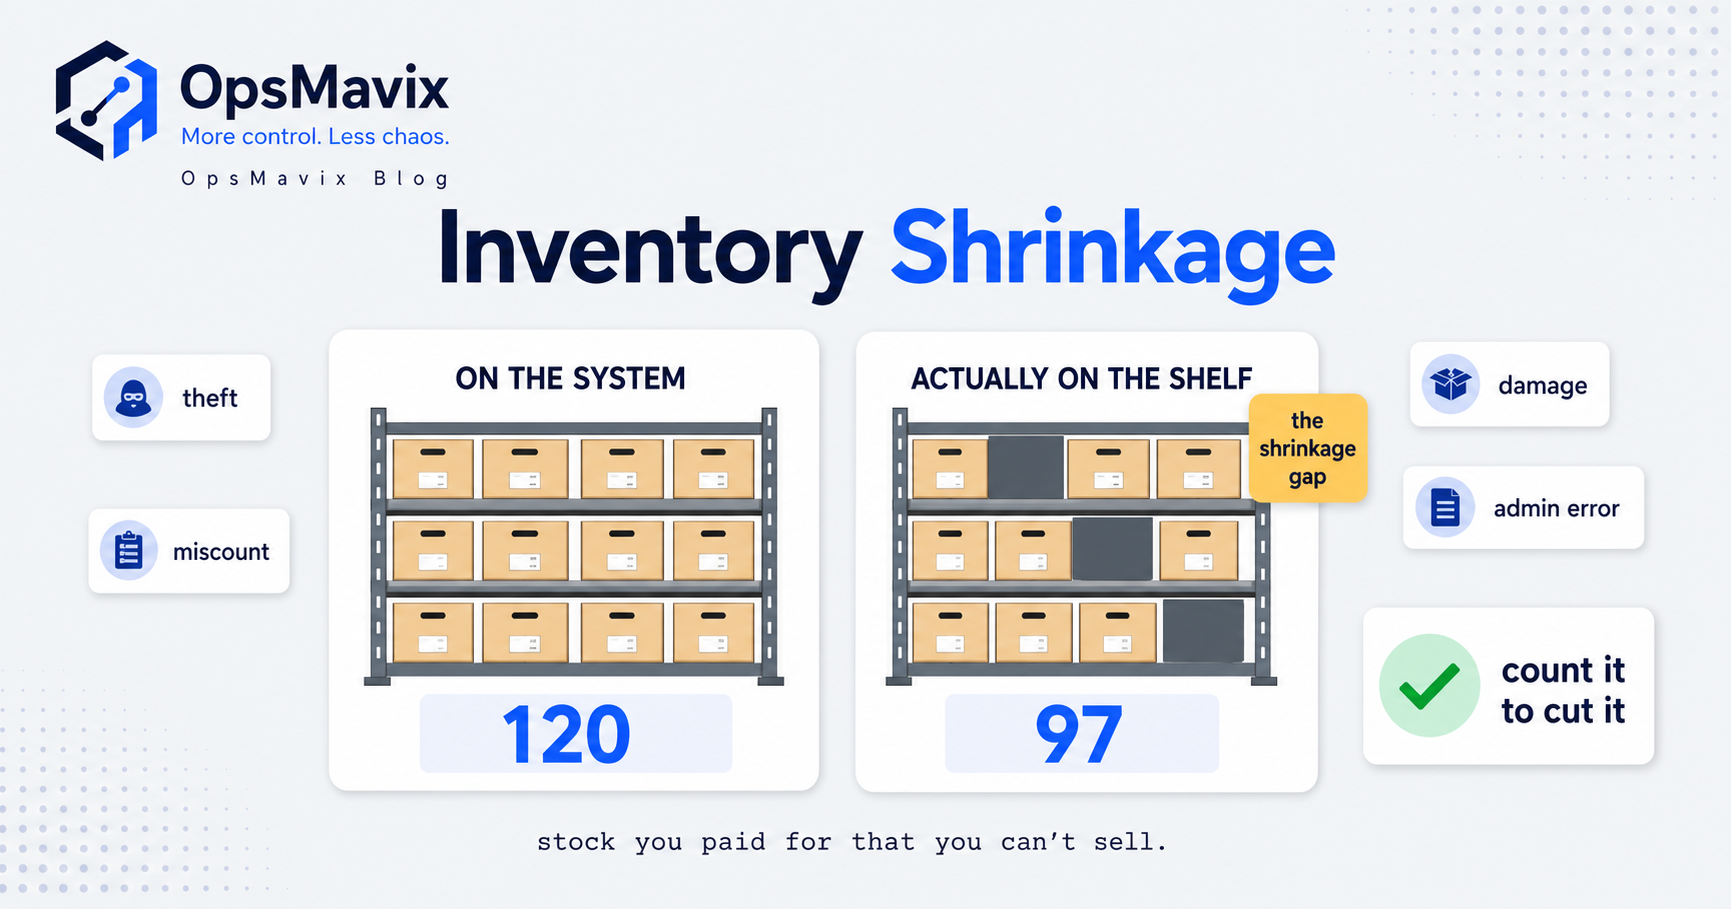
Inventory Shrinkage: What It Is, What Causes It, and How to Cut It
Inventory shrinkage is the gap between the stock your records say you own and the stock you actually have — units you paid for but cannot sell. This is the practical guide: the shrinkage-rate formula worked through in £, the real causes (theft, admin error, damage, supplier short-shipment, miscounts), how to measure it honestly, and how to cut it with accurate stock records, disciplined cycle counts and ABC focus on the high-value lines. It also draws the line most articles blur: shrinkage is the loss, a stock discrepancy is the count mismatch that reveals it.
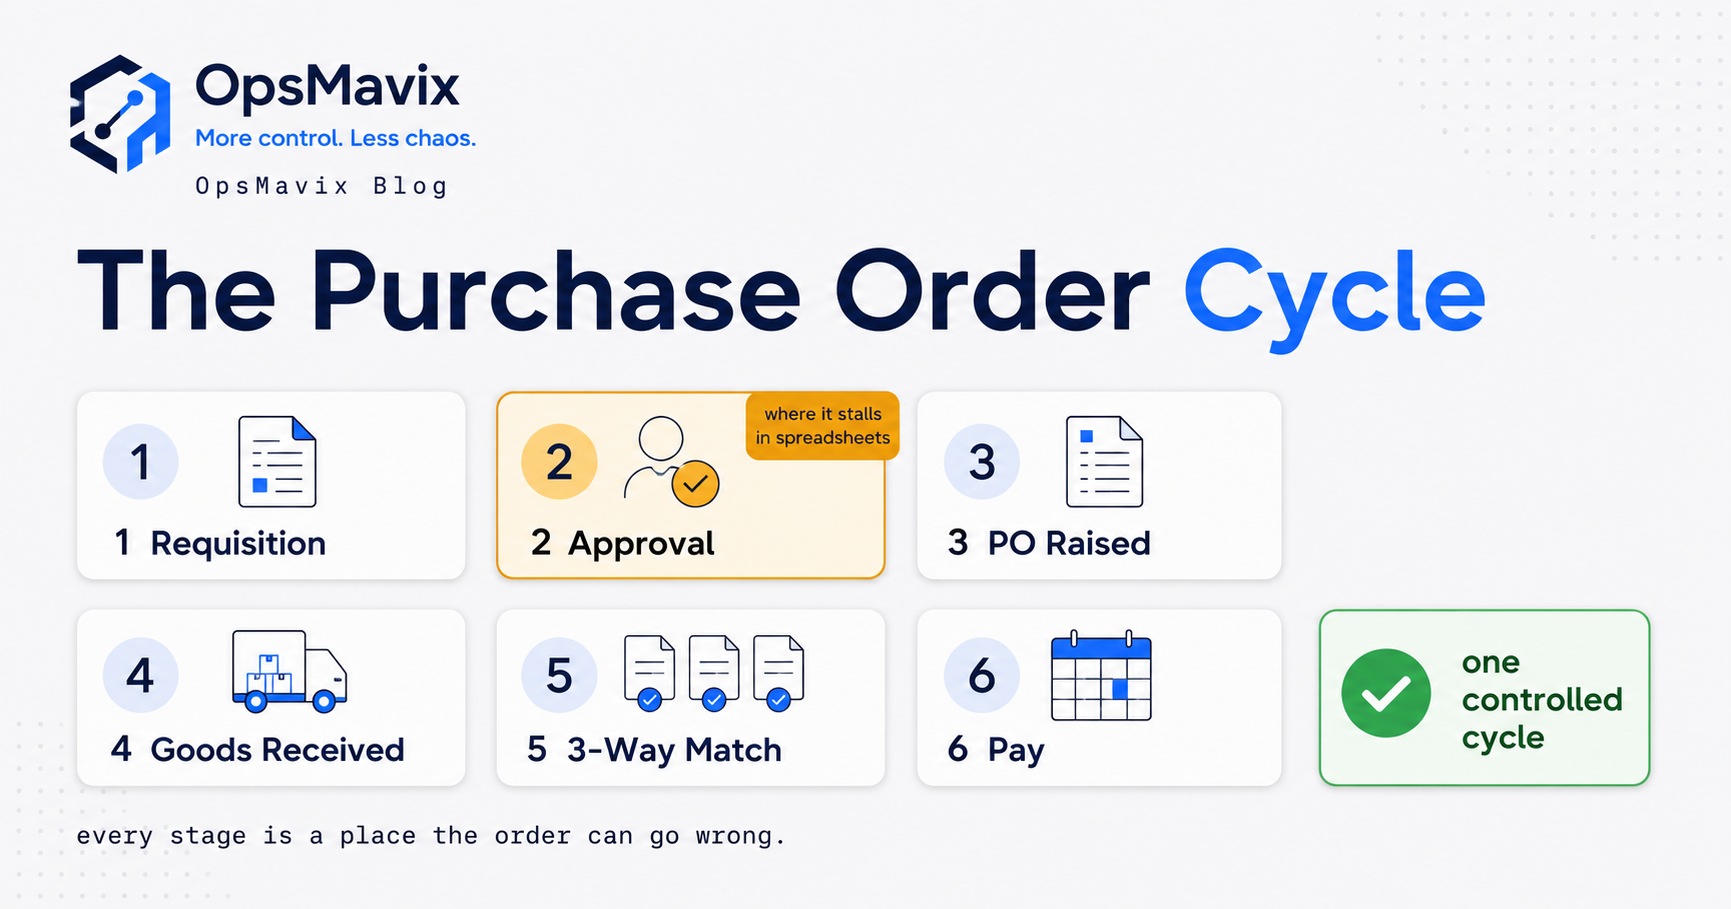
The Purchase Order Cycle, End to End (Procure-to-Pay)
The purchase order cycle runs from the moment someone identifies a need to the moment the order is paid and closed — requisition, approval, PO raised, sent to supplier, goods received, three-way match, invoice, payment, close. This guide walks every stage end to end, explains what each one is for and who owns it, shows exactly where each stage breaks when it lives in email and spreadsheets — missed approvals, wrong quantities, unmatched invoices — and how an owned system controls the whole cycle from one view instead of nine disconnected steps.
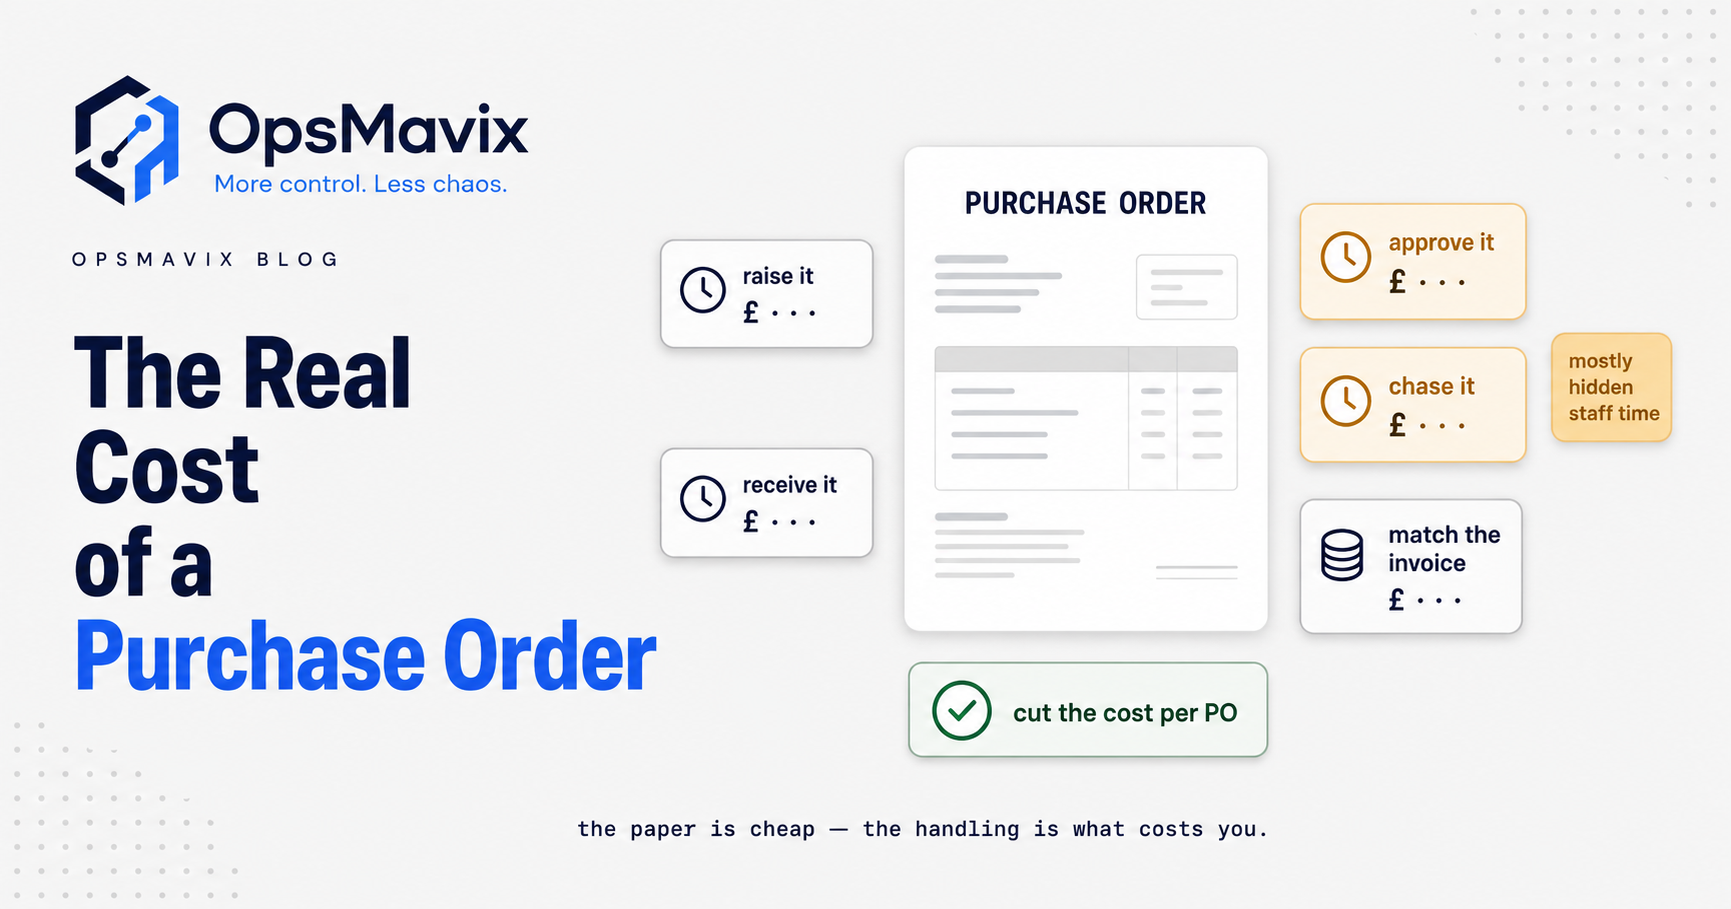
What Does It Actually Cost to Process a Purchase Order?
The cost of processing a purchase order has almost nothing to do with the price of what you're buying — it's the hidden labour of raising, approving, chasing, receiving and matching every order, plus the extras nobody counts (maverick spend, wrong quantities, late deliveries). This guide breaks the per-PO cost into its real components, gives you a transparent £ worked build-up you can plug your own numbers into, and shows how tightening the requisition-to-match flow cuts what each order costs to handle.
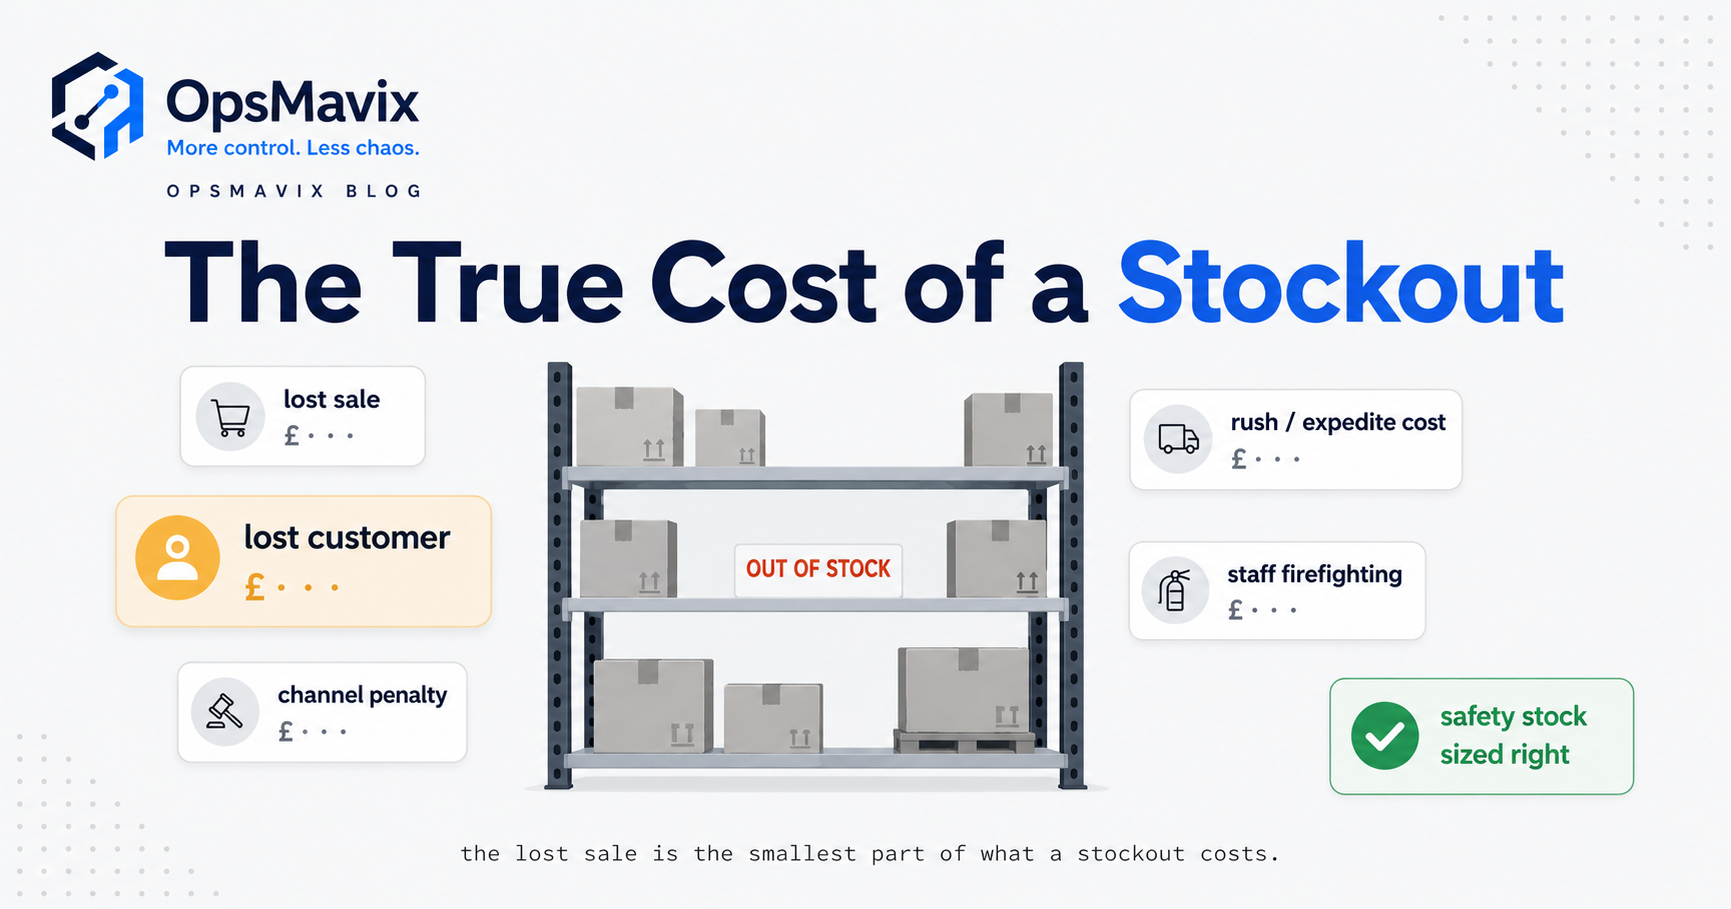
The True Cost of a Stockout (and How to Stop Overselling)
A stockout does not cost you one sale. It costs the margin on that sale, sometimes the customer for good, a dent in your marketplace ranking, a rush-freight bill to recover, and hours of staff firefighting. This guide breaks the full cost down into five parts, gives you a simple £ framework to estimate it for your own business, separates a true stockout from a phantom-stock oversell, and lays out the operational fixes.
Operations Planning and Control: What It Means in Practice (Not the Textbook)
Operations planning and control is two halves of one loop — planning decides what should happen (demand, capacity, purchasing, scheduling) and control makes the actual match the plan (tracking, variance, correction). This guide maps the concept onto real daily operations with two worked examples, explains why spreadsheets quietly break the control half, and shows how an owned operations system closes the loop.
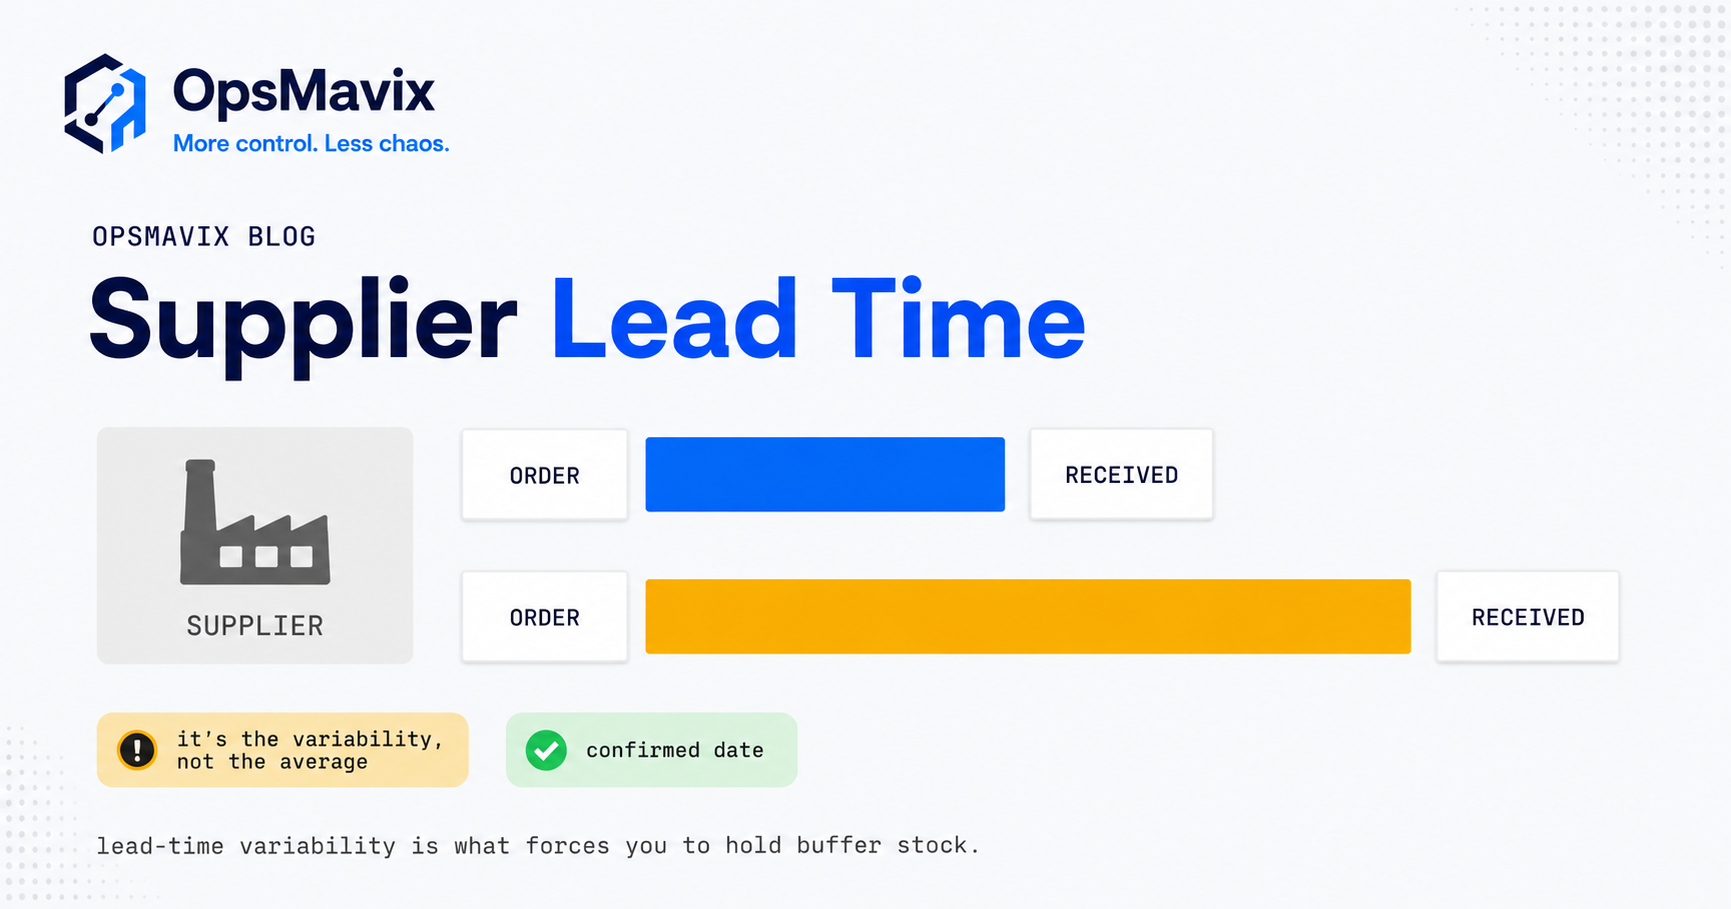
Supplier Lead Time: How to Measure It, Why Variability Hurts, and How to Reduce It
Supplier lead time is the clock from placing an order to the goods being sellable on your shelf — and it is the number that quietly sizes your safety stock, your reorder points and the cash frozen in buffer. This guide breaks it into its four components, shows how to measure it from your own purchase-order and goods-received dates, explains why the variability matters far more than the average, and gives the practical levers that reduce and stabilise it.
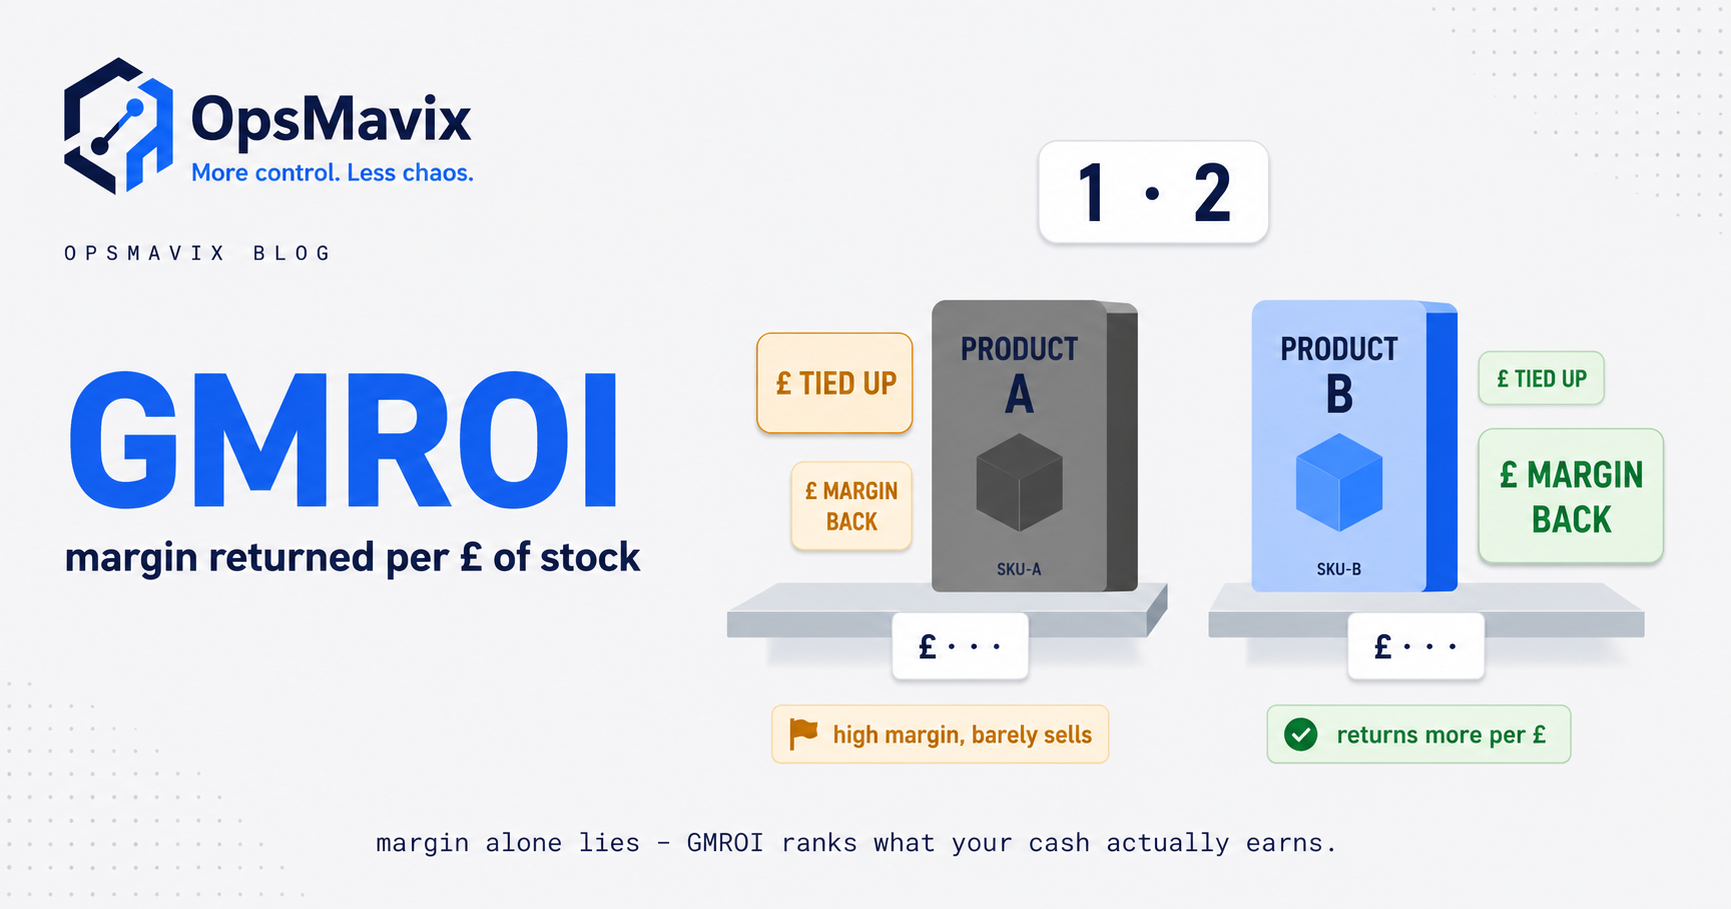
GMROI: The Inventory Metric That Ties Stock to Profit
GMROI answers the one question margin and turnover each answer only half of: for every pound sitting in stock, how many pounds of gross margin does it earn you back? This is the formula, a plain-English worked example in pounds, why a low-margin fast-mover can beat a high-margin slow-mover, and how to use GMROI to rank products and cull ranges.